
How we built distributed counting of top ‘K’ service users
Freshworks and its products are all based on a multi-tenant approach, and thus, understanding the top ‘k’ accounts (or any ‘item’) for any service is needed for various purposes, be it for general tracking or even sharding. This is more important for real-time products, because they would need a way to calculate the top accounts on a streaming basis as throughputs are high and calculations need to be done fast alongside taking the minimum CPU cycles.
As a central team building real-time services for all other engineering teams, we needed a model to understand which accounts are the heavy hitters. So, we built the “Streaming Top K Instrumentation” which helps us collect statistics on the top ‘k’ accounts using the service on a pull-based mechanism.
For the defined problem, the Redis sorted sets seemed to be an ideal data-structure. We could add accounts and increment its score value of messages per users. Then the top ‘k’ accounts would just be a query to Redis with the given limits. However, it would mean constant hitting at Redis, which is also used for other purposes, in a system like RTS. Also, such a sorted set would have values of every account. At the scale with which Freshdesk operates, it doesn’t make sense to store 100,000 accounts just to find the top 100. We also needed to keep the cost of this instrumentation low, so it would not add additional latencies or need too much work.
So we split the problem of top ‘k’ from a central one at Redis to a distributed one local to each machine node. Now, each node can calculate its top 100 accounts for a given dimension (messages, users, etc.) and at a periodic interval push to only the top items in the Redis sorted set. The fetching remains the same. This way we can save on the number of network calls to and data stored in Redis.
Next, we needed an efficient way to calculate and instrument the top ‘k’ items. A quick solution was to put all the accounts and scores on a map, allowing quick instrumentation. But fetching the top ‘k’ involved sorting the whole set. Therefore, we built our own data-structure.
The Data Structure
The data structure that we built would enable us to quickly update the score and fetch the top ‘k’ entries. The top ‘k’ data-structure internally contains three simple data structures – a ‘map’, a ‘min heap’ and a ‘max heap’. The map will give us the quick access to the item. The item may either belong to the min heap (top 100 – if heavily used) or max heap. Each node in the heap stores a pointer to an item which has a structure similar to that as shown below:
type Item struct {
name string
score int
class Class
}
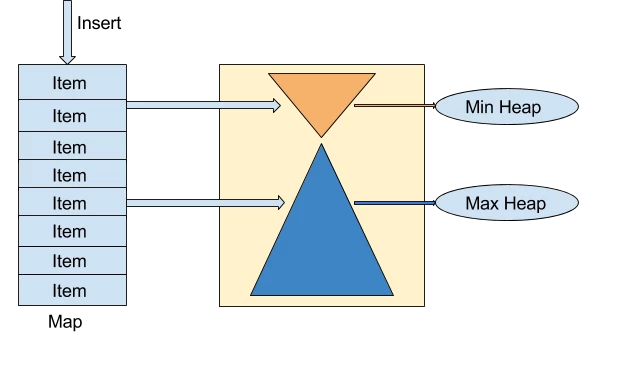
The map stores the mapping of the item address to its name while the heaps store the addresses of the items. The min-heap will contain the top ‘k’ accounts needed so the size of min-heap is always equal to ‘k’. The fetching of top ‘k’ items is always O(1). Inserts and updates to the structure would be k log(k) or n log(n) depending upon whether they are in min-heap (heavy hitters) or max-heap. The items in the min-heap are not in sorted order and need not be.
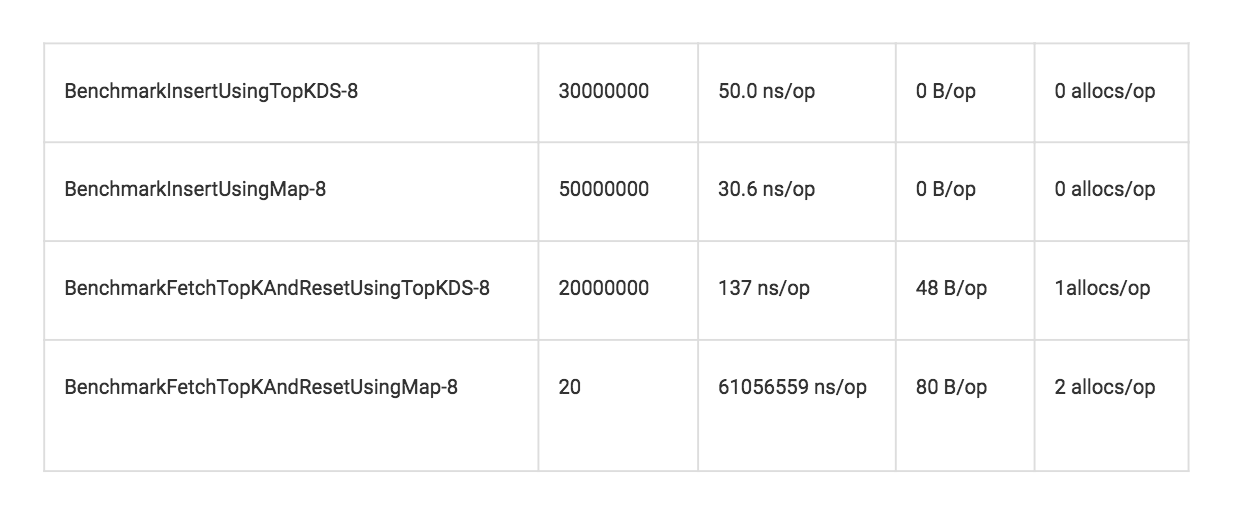
Benchmarks
We benchmarked our top-k data structure with a plain map-based model and found that while the insertion time in both models is comparable, retrieval is way faster.
The Process
Whenever a new operation occurs, the system checks if the item exists in the map. If it doesn’t exist, we add it. After that, we move it to the min or the max heap depending on the root node. All this happens on each server independently, making the process faster. When an item becomes the root of the max-heap, its score is updated. We check it against the score of the root of min-heap. If it surpasses substantially, we swap the root item of the min-heap with that of max-heap. Periodically, data is collected from the min-heap (as the Top Items are always in the min-heap) and pushed to Redis. The max-heap data is discarded and a new cycle with clean data structure is started. The min-heap data pushed from all servers gets accumulated in a specific key for the day in Redis as a sorted set.
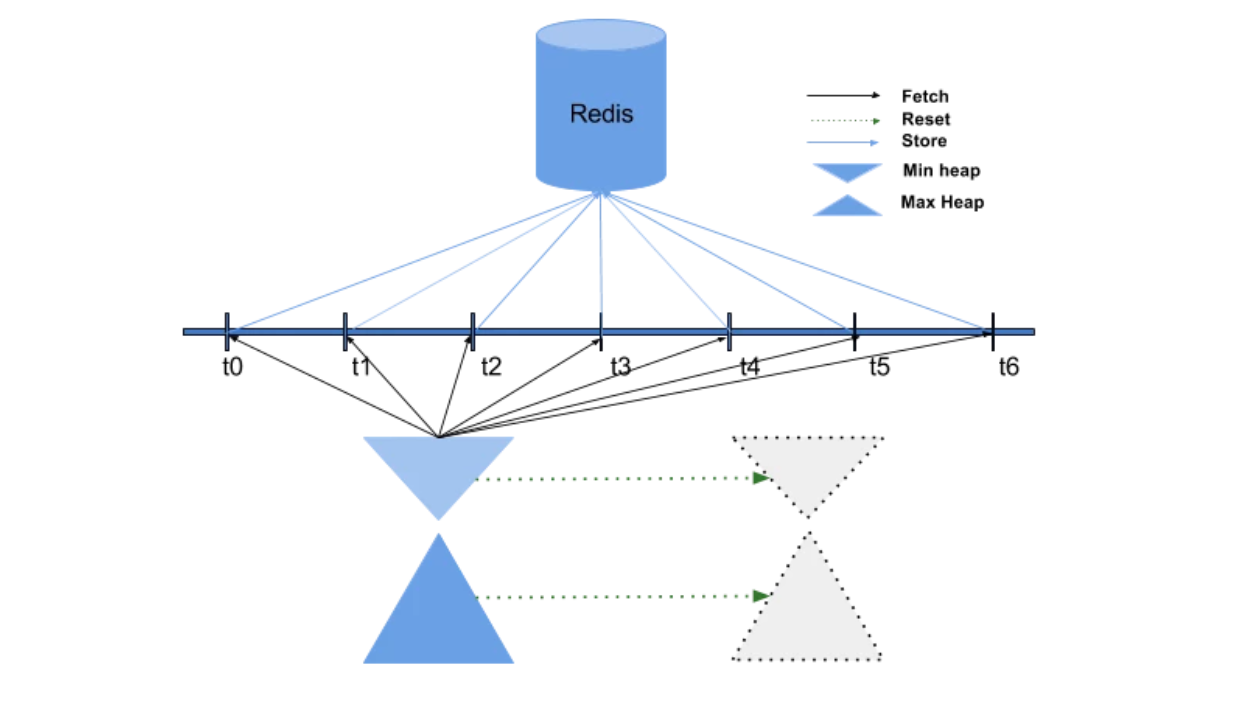
Since the data is statistical in nature, we only capture the top ‘k’ for the given period. Also, when the load is heavy, the instrumentation will drop data.
Take a look at the flowchart for a detailed explanation.
 Were you thinking of a use case when you were reading this? If yes, what was it?
Also, do you have another way to accomplish the same result or any suggestion to improve this process further?

