The agentic AI solution for modern, omnichannel customer service
With Freshdesk, AI agents and human agents work as one—resolving every issue, instantly and intelligently.
Omnichannel service. Smarter agents. Faster resolutions.
Unify every channel, cut the noise, and give agents an easy-to-use platform to resolve requests without missing a beat. With Freshdesk, you don’t just keep up, you stay ahead.
Auto-resolve issues with AI agents
AI agents go beyond suggestions. They take action. From resolving routine queries to updating records and processing requests, these digital teammates handle the busywork. No waiting, no hand-holding. Just automated resolutions, 24/7.
Learn more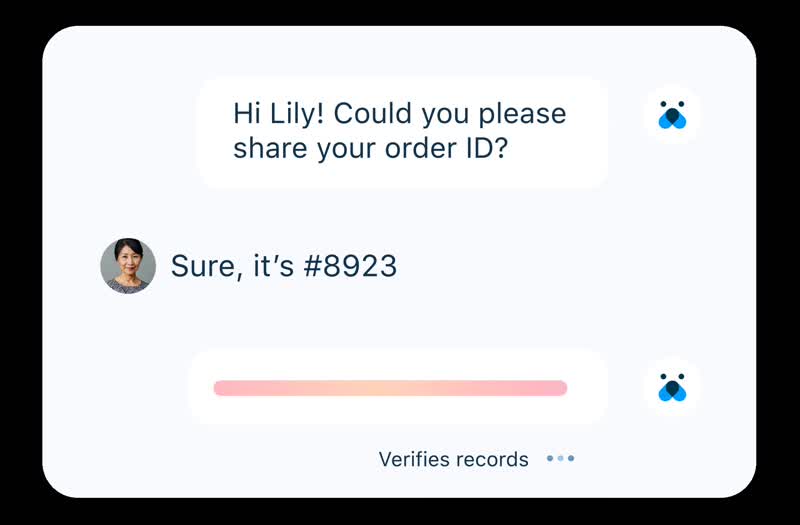
Empower support teams with intelligent assistance
AI Copilot helps agents with summaries, live translations, and reply suggestions—so they can respond faster and with confidence. No tab switching, no rewriting—just rich context and quick resolutions, right where they work.
Learn more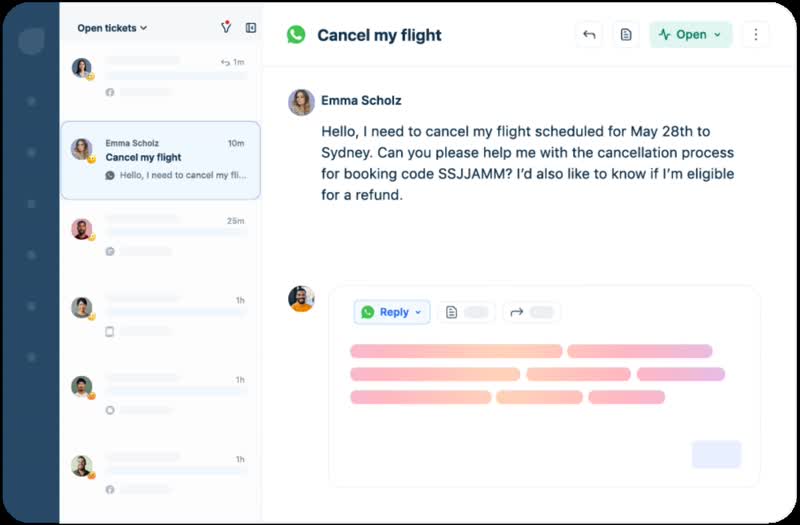
Meet your customers wherever they are
See every customer conversation across your channels in one smart inbox. Agents stay on top of every support issue, switch channels based on customer preferences, and respond faster without juggling tabs or tools.


Empower agents with complete context
Give your agents the context they need—customer details, past conversations, channel preferences, and third-party app insights, right where they work, so every customer interaction is personalized and on point.
Learn more

The complete customer service platform
Everything you need to support customers and empower teams—all in one place.
Make every phone call personal
Connect phone support with your digital channels. Get caller info instantly, route the call, and resolve issues in one smooth interaction.


AI for modern customer experiences
Freddy AI combines powerful AI agents and copilot to deliver fast, seamless support. AI agents handle customer queries across channels, while AI copilot guides your team with context, suggestions, and knowledge—so every conversation moves faster and feels effortless.
Meet Freddy AIA complete solution for customer service teams
Improve efficiency and deliver excellent customer service every step of the way, thanks to a powerful array of capabilities enhanced with AI.
See what’s newAdvanced ticketing
Resolve customer issues faster with robust ticketing supported by AI and automation.
Unified agent workspace
See the full customer story with past interactions, apps, and context.
Self-service
Resolve customer queries 24/7 with personalized support from AI agents across channels.
Collaboration
Loop in teammates, start discussions, and ensure no tasks slip through the cracks.
Analytics & Insights
Visualize trends and share dashboards for better decision-making.
AI and automation
Let Freddy AI help customers, agents, admins, and leaders do more with less time and effort.
Omnichannel solution
Engage customers wherever they are, including email, text, social, and other channels.
Streamlined admin
Take the pressure off admins with AI, workflow automation, and easy customizations.
Freddy AI Agent
Resolve queries at scale with speed and accuracy to take action and resolve tickets end-to-end.
The experts have spoken


Connect your business apps
Integrate with the tools your team relies on, all natively built into Freshdesk. Get started without extra costs or complexity.
View integrations

FAQs
Find answers to common questions about Freshdesk Omni, the AI-powered, omnichannel customer service software.
What is Freshdesk Omni?
Freshdesk Omni (formerly Freshworks Customer Service Suite) is an easy-to-use, AI-powered support solution that unifies customer engagement across channels on a single platform. Freshdesk Omni brings everything businesses need to quickly solve customer issues, supercharge agent productivity, and provide proactive insights to managers and leaders.
How does Freshdesk Omni improve customer service?
Freshdesk Omni (formerly Freshworks Customer Service Suite) enables seamless customer support experiences across multiple channels (web, portal, SMS, social media, and email). Customers can interact with live agents or Freddy AI Agents, with all conversations maintained in a unified thread. This ensures consistent, personalized, and accurate support for customers.
How does Freshdesk Omni boost employee productivity?
Agents become hyper-efficient with Freshdesk Omni's unified workspace that brings all customer interactions into a single view. This means agents spend less time searching for information across disjointed tools and more time resolving customer queries. Freshdesk Omni is also intuitive and easy to use, helping agents ramp up quicker with minimal training. Freddy AI Copilot enhances agent performance with real-time coaching, enabling faster resolutions and superior customer support at scale.
What is the difference between Freshdesk Omni and Customer Service Suite?
Freshdesk Omni is the new name for what was formerly known as Freshworks Customer Service Suite (CSS). While the Freshdesk Omni name and branding are new, they build on a strong foundation of our existing powerful Freshdesk and Freshchat capabilities.
Are Freshdesk Omni and Customer Service Suite different products?
They are the same product. Freshworks Customer Service Suite has been rebranded as Freshdesk Omni. Freshdesk Omni is a conversations-first, AI-powered customer support solution. It brings everything companies need to quickly solve customer issues, supercharge agent productivity, and provide proactive insights to managers and leaders in one place.
What are the benefits of Freshdesk Omni for support teams?
With Freshdesk Omni, support teams can deliver exceptional customer service. The modern, easy-to-use interface and AI-powered coaching enable agents to resolve customer issues faster, boosting team productivity. With 360-degree customer view, advanced ticketing, automated routing, and support for 40+ languages, teams can provide consistent, global support. This means improved support metrics like higher interactions per hour, lower average handle time (AHT), and higher first contact resolution (FCR).
How does Freshdesk Omni make managers more effective?
Freshdesk Omni (formerly Freshworks Customer Service Suite) empowers managers with AI-powered insights and customized dashboards to effortlessly spot trends, assess performance, and make quicker, smarter business decisions. Managers and leaders can continually analyze performance data, surface key issues that need attention, and take the next best actions based on Freddy’s suggestions.
Can Freshdesk Omni be customized to fit my business needs?
Yes, Freshdesk Omni is highly customizable and is being used by businesses of all sizes. Users can tailor workflows, build and deploy AI-powered chatbots, and integrate with more than 1,000 apps to suit specific business requirements, ensuring a comprehensive omnichannel support strategy.
Is Freshdesk Omni suitable for small businesses?
Yes, Freshdesk Omni is custom-built for growing businesses. It is quick to deploy, easy to use, and simple to manage without technical expertise. With features like advanced ticketing, automation, Freddy AI Copilot, and Freddy AI Insights, small businesses can deliver efficient customer support while keeping costs manageable. Plus, you can start with the features you need today and expand as your business grows.
How does Freshworks ensure data security and compliance for Freshdesk Omni?
Freshworks employs advanced security measures, including data encryption, regular audits, and compliance with global standards such as GDPR, to ensure customer data is always protected across all channels. Our servers are hosted in world-class data centers, and we ensure that our application is always up to date with the latest security patches.
Explore insights & resources on AI-powered customer service
Real-world stories, practical insights, and tools to help you deliver modern, AI-powered customer service.

Benchmark your success with insights from our 2025 customer service report
Evaluate your performance against industry competitors to see how you measure up.

Tata resolves half of all queries with chatbots
Learn why Freshworks was the only choice for launching India’s first super app, Tata Neu.

Forrester on the TEI of Freshworks
See the Total Economic Impact of ticketing and conversational support in one with Freshworks.
What our customers are saying

With Freshworks, our AI agents can address inquiries round the clock. It’s a powerful feature to improve the customer experience while freeing our [team] to focus on immediate traveler needs.

I had team members who weren’t comfortable at all with emails. With Freddy AI, they’ve gained so much confidence, and the quality of emails they’re sending now is remarkable.
We adopted Freddy for highly automated and personalized customer experiences. For PhonePe, Freddy fetches context from the transactions made and offers contextual assistance for a personalized self-service experience from right within the app.
Take a fresh approach to customer service
See what refreshingly easy software can do for your business.
