
Grasping memory leaks in single-page applications
Editor’s note: This is the first installment of a two-part series on exploring memory leaks and their proactive identification within the Ember JS framework. Here, we delve into the causes and consequences of memory leaks in application development. In Part Two, we discuss proactive strategies for identifying and mitigating memory leaks specifically within Ember JS. Through practical examples, we’ll equip you with the knowledge and tools necessary to conduct thorough memory leak analysis and optimize your Ember applications for peak performance.
Introduction
Heap is a region of a computer’s memory used for dynamic memory allocation, where data is stored and managed during a program’s execution. In the context of web browsers, heap memory is essential for managing the memory allocation for JavaScript and the Document Object Model (DOM).
In a browser like Google Chrome, the heap size refers to the amount of memory allocated for JavaScript execution within the browser. Chrome’s V8 JavaScript engine, which powers the browser, manages this heap. The heap size can vary depending on several factors, including the user’s system resources and the specific version of the browser.
Understanding memory leaks
Memory leaks occur when memory that is allocated for an object in a computer program is not properly released, even after the object is no longer needed. This can happen because of programming errors or inefficiencies in the way memory is managed by the program.
Think of memory in a computer program like water in a bucket. Just as you fill a bucket with water when you need it and empty it when you’re done, a program allocates memory for objects when they are created and releases that memory when the objects are no longer needed. However, imagine there’s a small hole in the bottom of the bucket. Even when you’re not using the bucket, the water drips slowly through the hole, wasting resources.
A memory leak is like that hole in the bucket—memory that should be released isn’t, leading to a gradual buildup of unused memory that can eventually slow down or crash the program.
Single-page applications: Vulnerable to memory leaks
Single-page applications (SPAs) built on frameworks like Ember, React, or any other modern JavaScript framework are not inherently more prone to memory leaks than traditional multi-page applications. But they can be more susceptible to memory management issues due to their specific characteristics and complexities and the way these frameworks work.
Here are some reasons why SPAs may be more prone to memory leaks:
Longer lifespan of pages: SPAs load a single HTML page and use it throughout the application’s lifetime. This means that objects and data associated with a page may persist longer in memory, increasing the chances of memory leaks if they are not properly released when no longer needed
Event listeners: SPAs often use event listeners to handle user interactions and updates. If these event listeners are not removed when they are no longer needed, they can lead to memory leaks
Reference cycles: In SPAs, reference cycles can easily occur, where objects reference each other in a way that prevents them from being garbage-collected. For example, a component can reference an object in a closure, preventing the closure from being collected
Data caching: SPAs often cache data for better performance. If data is not managed and cleared properly, it can lead to memory bloat and potential memory leaks
Mitigation of memory leaks
To mitigate memory leaks in SPAs, developers need to be diligent about managing memory and resources. This includes:
- Properly managing the lifecycle of components, event listeners, and objects.
- Identifying and breaking reference cycles.
- Using built-in tools and libraries for memory profiling and debugging.
- Thoroughly testing and profiling applications to catch and resolve memory leaks.
Monitoring memory leaks
We can use browser developer tools (e.g., Chrome DevTools, Firefox Developer Tools) to profile memory usage. Look for consistently increasing memory consumption.
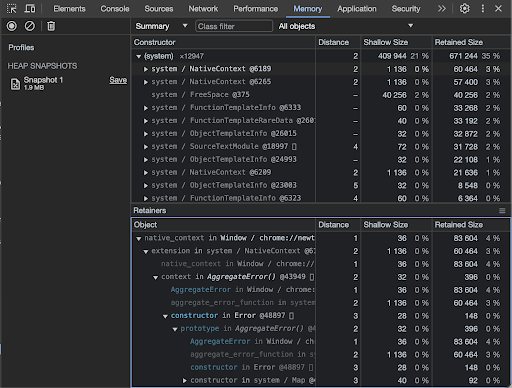
Heap snapshots in developer tools can reveal retained objects and help identify which parts of your code are causing memory leaks.
Conclusion
In Part One of this series, we’ve explored the fundamentals of memory leaks, including their causes and consequences in application development.
In the next installment of our series about mastering memory management in Ember development, we’ll dive deeper into proactive strategies for identifying and mitigating memory leaks within the Ember JS framework. From advanced debugging techniques to leveraging specialized tools, we’ll provide actionable insights and practical examples to help you optimize your Ember applications for peak performance.

