
Strategies for preventing leaks in Ember JS-based applications
Editor’s note: This is the second installment of a two-part series on exploring memory leaks and their proactive identification within the Ember JS framework. In Part One, we explored the nuances of memory leaks and underscored typical pitfalls to be cautious of when crafting single-page applications. Now, our focus shifts to exploring targeted strategies for averting memory leaks within the Ember JS framework. Additionally, we will delve into proactive approaches and available tools to identify and address these issues.
Optimal strategies for preventing memory leaks
Here are some of the best practices in the Ember JS framework.
Proper component cleanup:
- Use the willDestroyElement and willDestroy component lifecycle hooks to release any resources such as event listeners, timers, and external references
- Remove any event listeners or timers you’ve added within the component when it’s destroyed to prevent them from accumulating

Use services:
Instead of storing application-wide state directly in components, consider using Ember Services. Services help centralize and manage shared state and data more effectively.

Binding removal:
Remove bindings between objects or components when they are no longer needed to prevent unnecessary memory retention.

Use Ember Data properly:
When using Ember Data, be cautious about creating a large number of records in the store, as they can accumulate in memory. Use unloadRecord or unloadAll to remove records when they are no longer needed.
Additionally, this is a valuable GitHub repository of illustrative instances of memory leaks. This repository serves as an excellent initial resource for recognizing memory leaks and learning how to rectify them.
Proactive tools for detecting memory leaks
Chrome heap snapshot analyzer
Google Chrome provides an excellent memory allocation analyzer for visualizing an application’s heap memory usage. Here are the steps to perform memory leak analysis within an Ember test suite:
1. Ensure comprehensive test coverage for your application. More tests mean a higher chance of identifying memory leaks
2. Run Ember tests, initially focusing on specific modules. This allows you to isolate tests and incrementally address any memory leaks
JavaScript:
ember test –serve –filter=<MODULE/TEST TYPE>
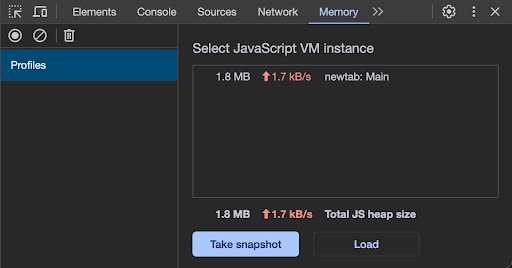
3. After a test run, refer to the Chrome DevTools guide on how to capture a heap snapshot
4. If you have followed the guidance in ember-memory-leak-examples, you’ll know that Ember stores everything in a container object. Examine the heap snapshot for these containers and filter them to pinpoint the root causes of memory leaks
5. Consider using a tool like Cleanheap, which can clear Weak Retainers or Weak References that may linger in the snapshots. Re-upload the cleaned-up snapshots (using the “Load” option in Chrome profiler) to the browser
6. Identify any remaining Container classes in the snapshots, fix them in your code, and repeat the process from step 2 until no such classes are present
7. This is an ongoing process that should be integrated into your development workflow to continuously identify and resolve memory leaks
This process provides a comprehensive approach to detecting and resolving memory leaks, but it relies heavily on manual effort and may not be easily scalable for larger development teams working on multiple aspects of the application.
To streamline and automate this process, create a library that significantly enhances the developer experience.
ember-cli-memory-leak-detector
This is an Ember add-on designed to aid in the detection of memory leaks within your application. What sets it apart is its proactive approach, which allows you to identify leaks during development, fostering a leak-free test-driven development environment.
When integrated into your test suite, this add-on identifies classes that are retained within the application and flags any modules where issues arise. Additionally, it provides a clear and informative report on the retained classes, making it easier to spot and address potential memory leaks.
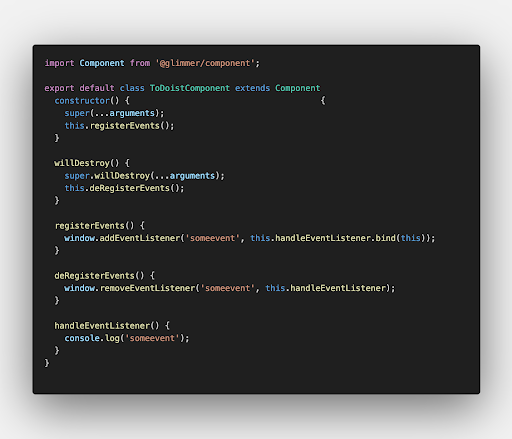
In Figure 1, we try to remove an event listener while the component is being destroyed. But the bind function will create a new function that loses the reference, thus causing a memory leak.
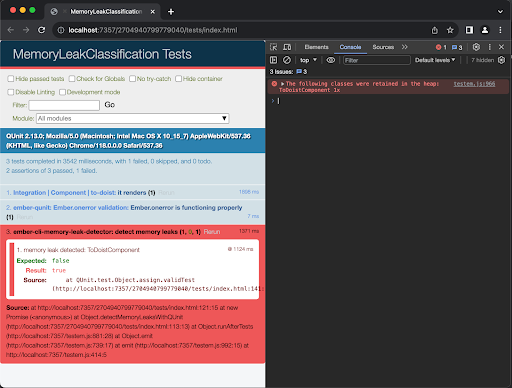
In Figure 2, the add-on captures those classes retained ToDoistComponent since there is a memory leak.
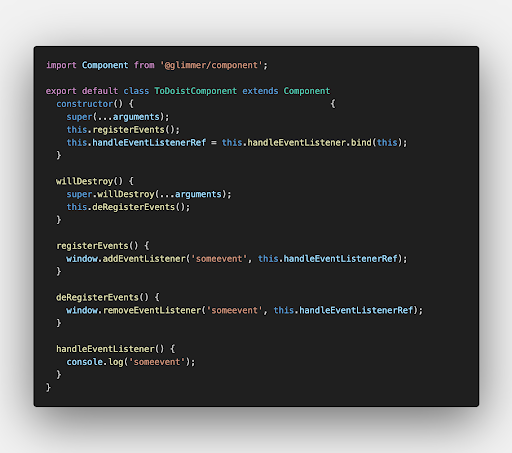
In Figure 3, the bind function reference has been captured in a variable, thus it can be removed safely.
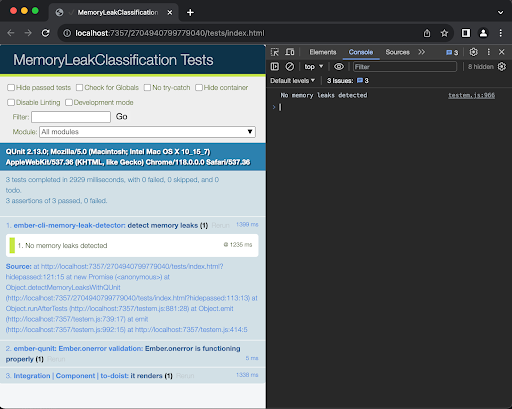
In Figure 4, the add-on passes since there are no leaks and thus no classes have been retained.
As promising as this add-on is, it currently comes with a few limitations:
- It lacks support for Ember Exam, an add-on that enables test execution in random order, parallel mode, and more. You can follow the progress on this issue
- There are instances where it may take longer than expected to display the results in the browser, leading to occasional browser timeouts
Nonetheless, despite these limitations, this add-on significantly contributes to the application development process by providing a faster feedback loop for identifying memory leaks within the system.

