ビジネス向けの強力なAI。あらゆるビジネス。
生成AIでカスタマーサービス、IT、CRMソフトウェアを強化。インテリジェントでスケーラブル、安全で使いやすい。

あらゆる規模の6万社以上の企業からの信頼
FRESHWORKS製品
使いやすい。すぐに実力を発揮。
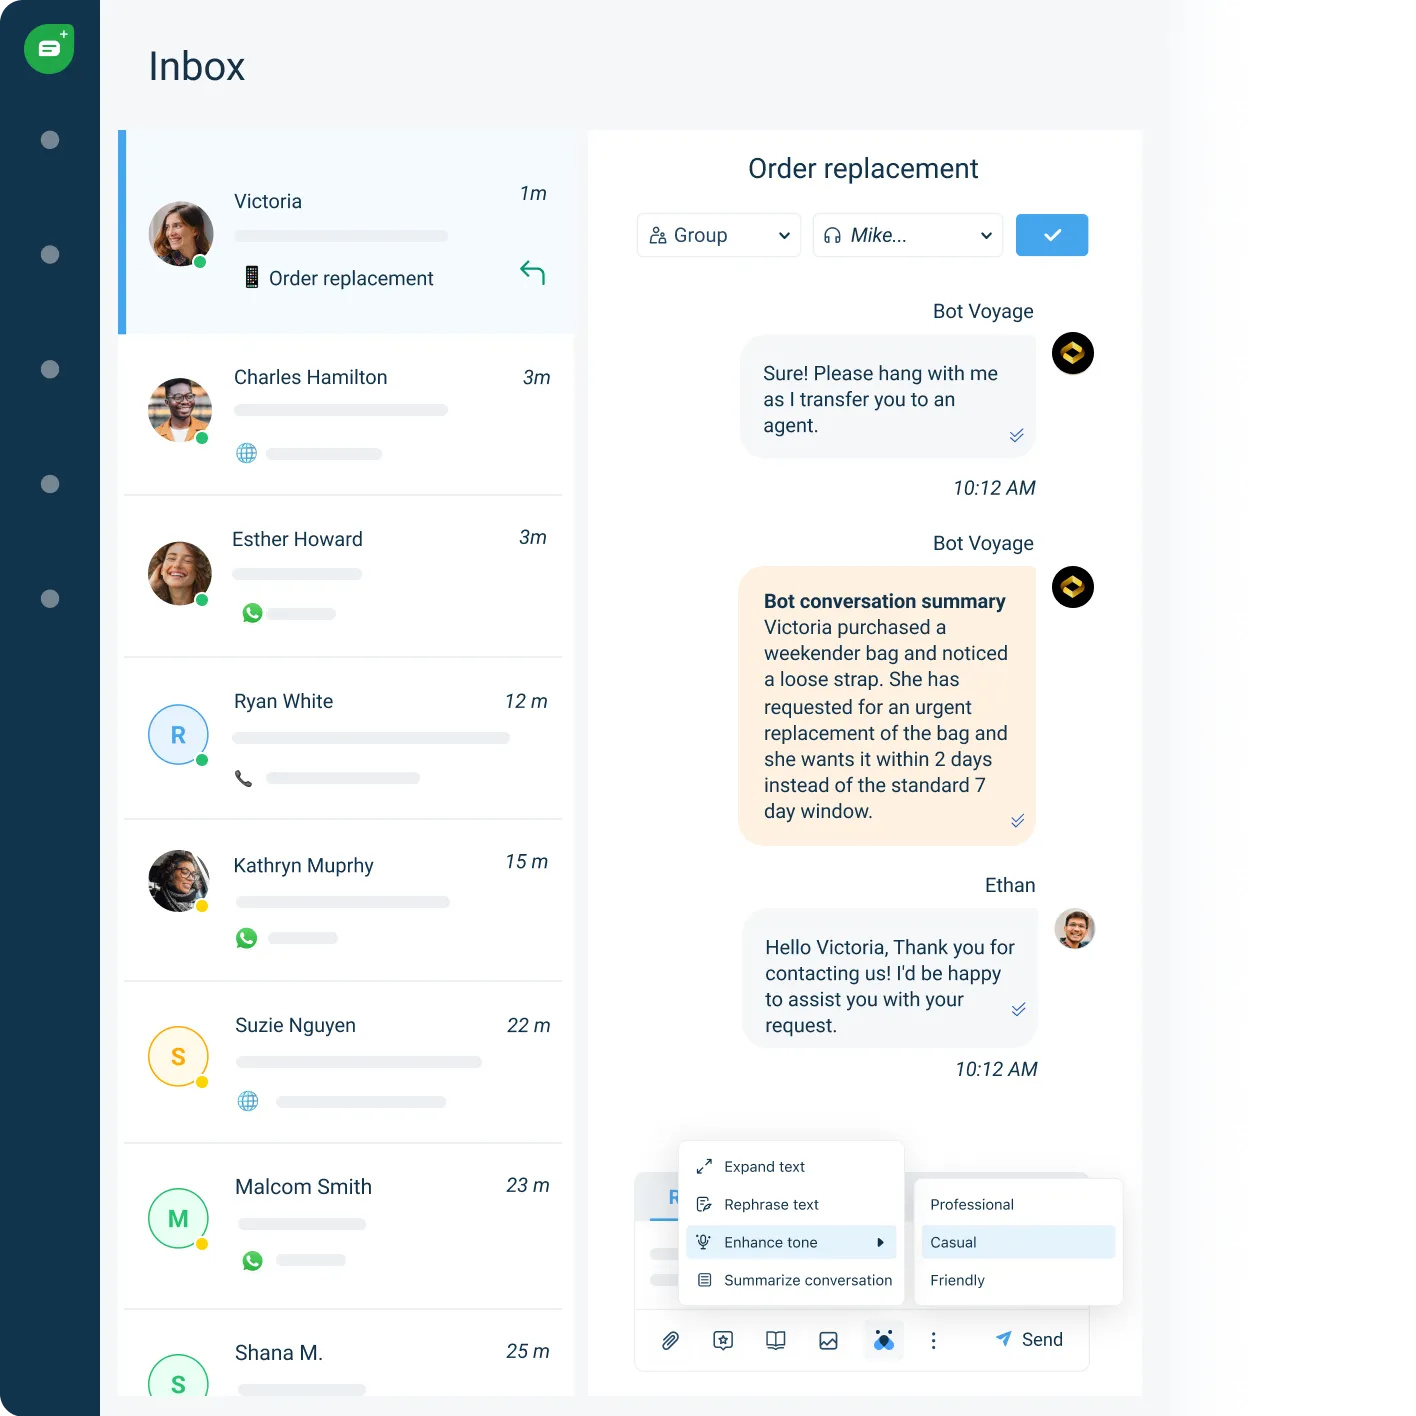
Customer Service Suite
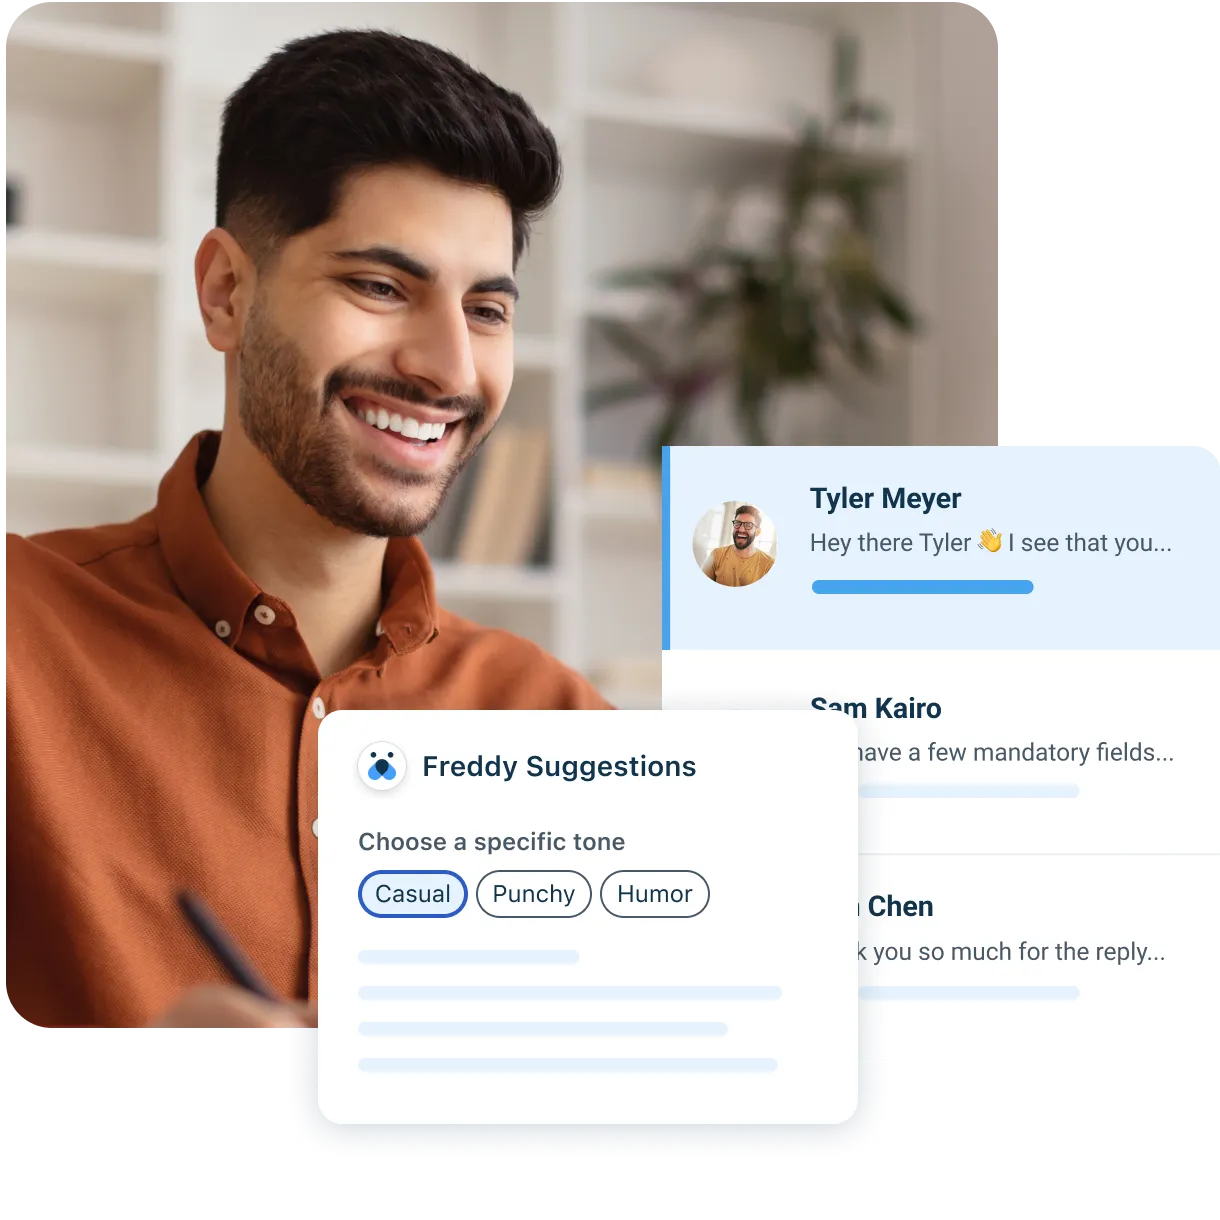
生成AIの力で必要なものをすべてカバーするオールインワンソリューション。
Freshservice
直感的で完全に統合されたITでITサービスと運用を最新化します。
Freshchat
あらゆるチャネルですべての顧客とより有意義に会話できます。
Freshdesk
統合されたインテリジェントなカスタマーサポートプラットフォームで、より速く拡張できます。
Freshsales
時間のかかるタスクを自動化して、スピーディーに営業成果を出します。
Freshmarketer
顧客に愛されるエンゲージメントチャネルを通じて、顧客を惹きつけ、エンゲージし、導きます。
すべての製品とトライアル