Sell smarter and close deals faster
Grow your pipeline, boost conversions, and power productivity with our AI-powered, easy-to-use sales CRM.
Everything sales, powered by AI
Simplify selling and grow your revenue with productivity, collaboration, and insights.
Smarter campaigns, superior leads
Freshsales helps you run smart sales campaigns to generate more leads, then capture, qualify, route, and track them with the power of Freddy AI.
Try it Free
Efficient organizing, expert prospecting
Declutter your sales view and have the key details you need to dive into your day with no wasted time. Plan your entire sales process with kanban views, and configure and control with drag-and-drop cards.
Get a Demo
Great conversations, higher conversions
Understand customers better with a 360° view, meet them on their preferred channels, and engage with context. Focus on valuable leads with intent scores from Freddy AI.
Try it Free
Stronger sales, faster growth
Streamline processes, sew up deals, and score that quarterly bonus with timely insights. Avoid bottlenecks and plan accurately with deal recommendations by Freddy AI.
Get a Demo
Less busywork, more business
Eliminate manual effort and save time by automating repetitive, mundane tasks. Improve productivity, increase adoption, and raise team morale.
Try it Free
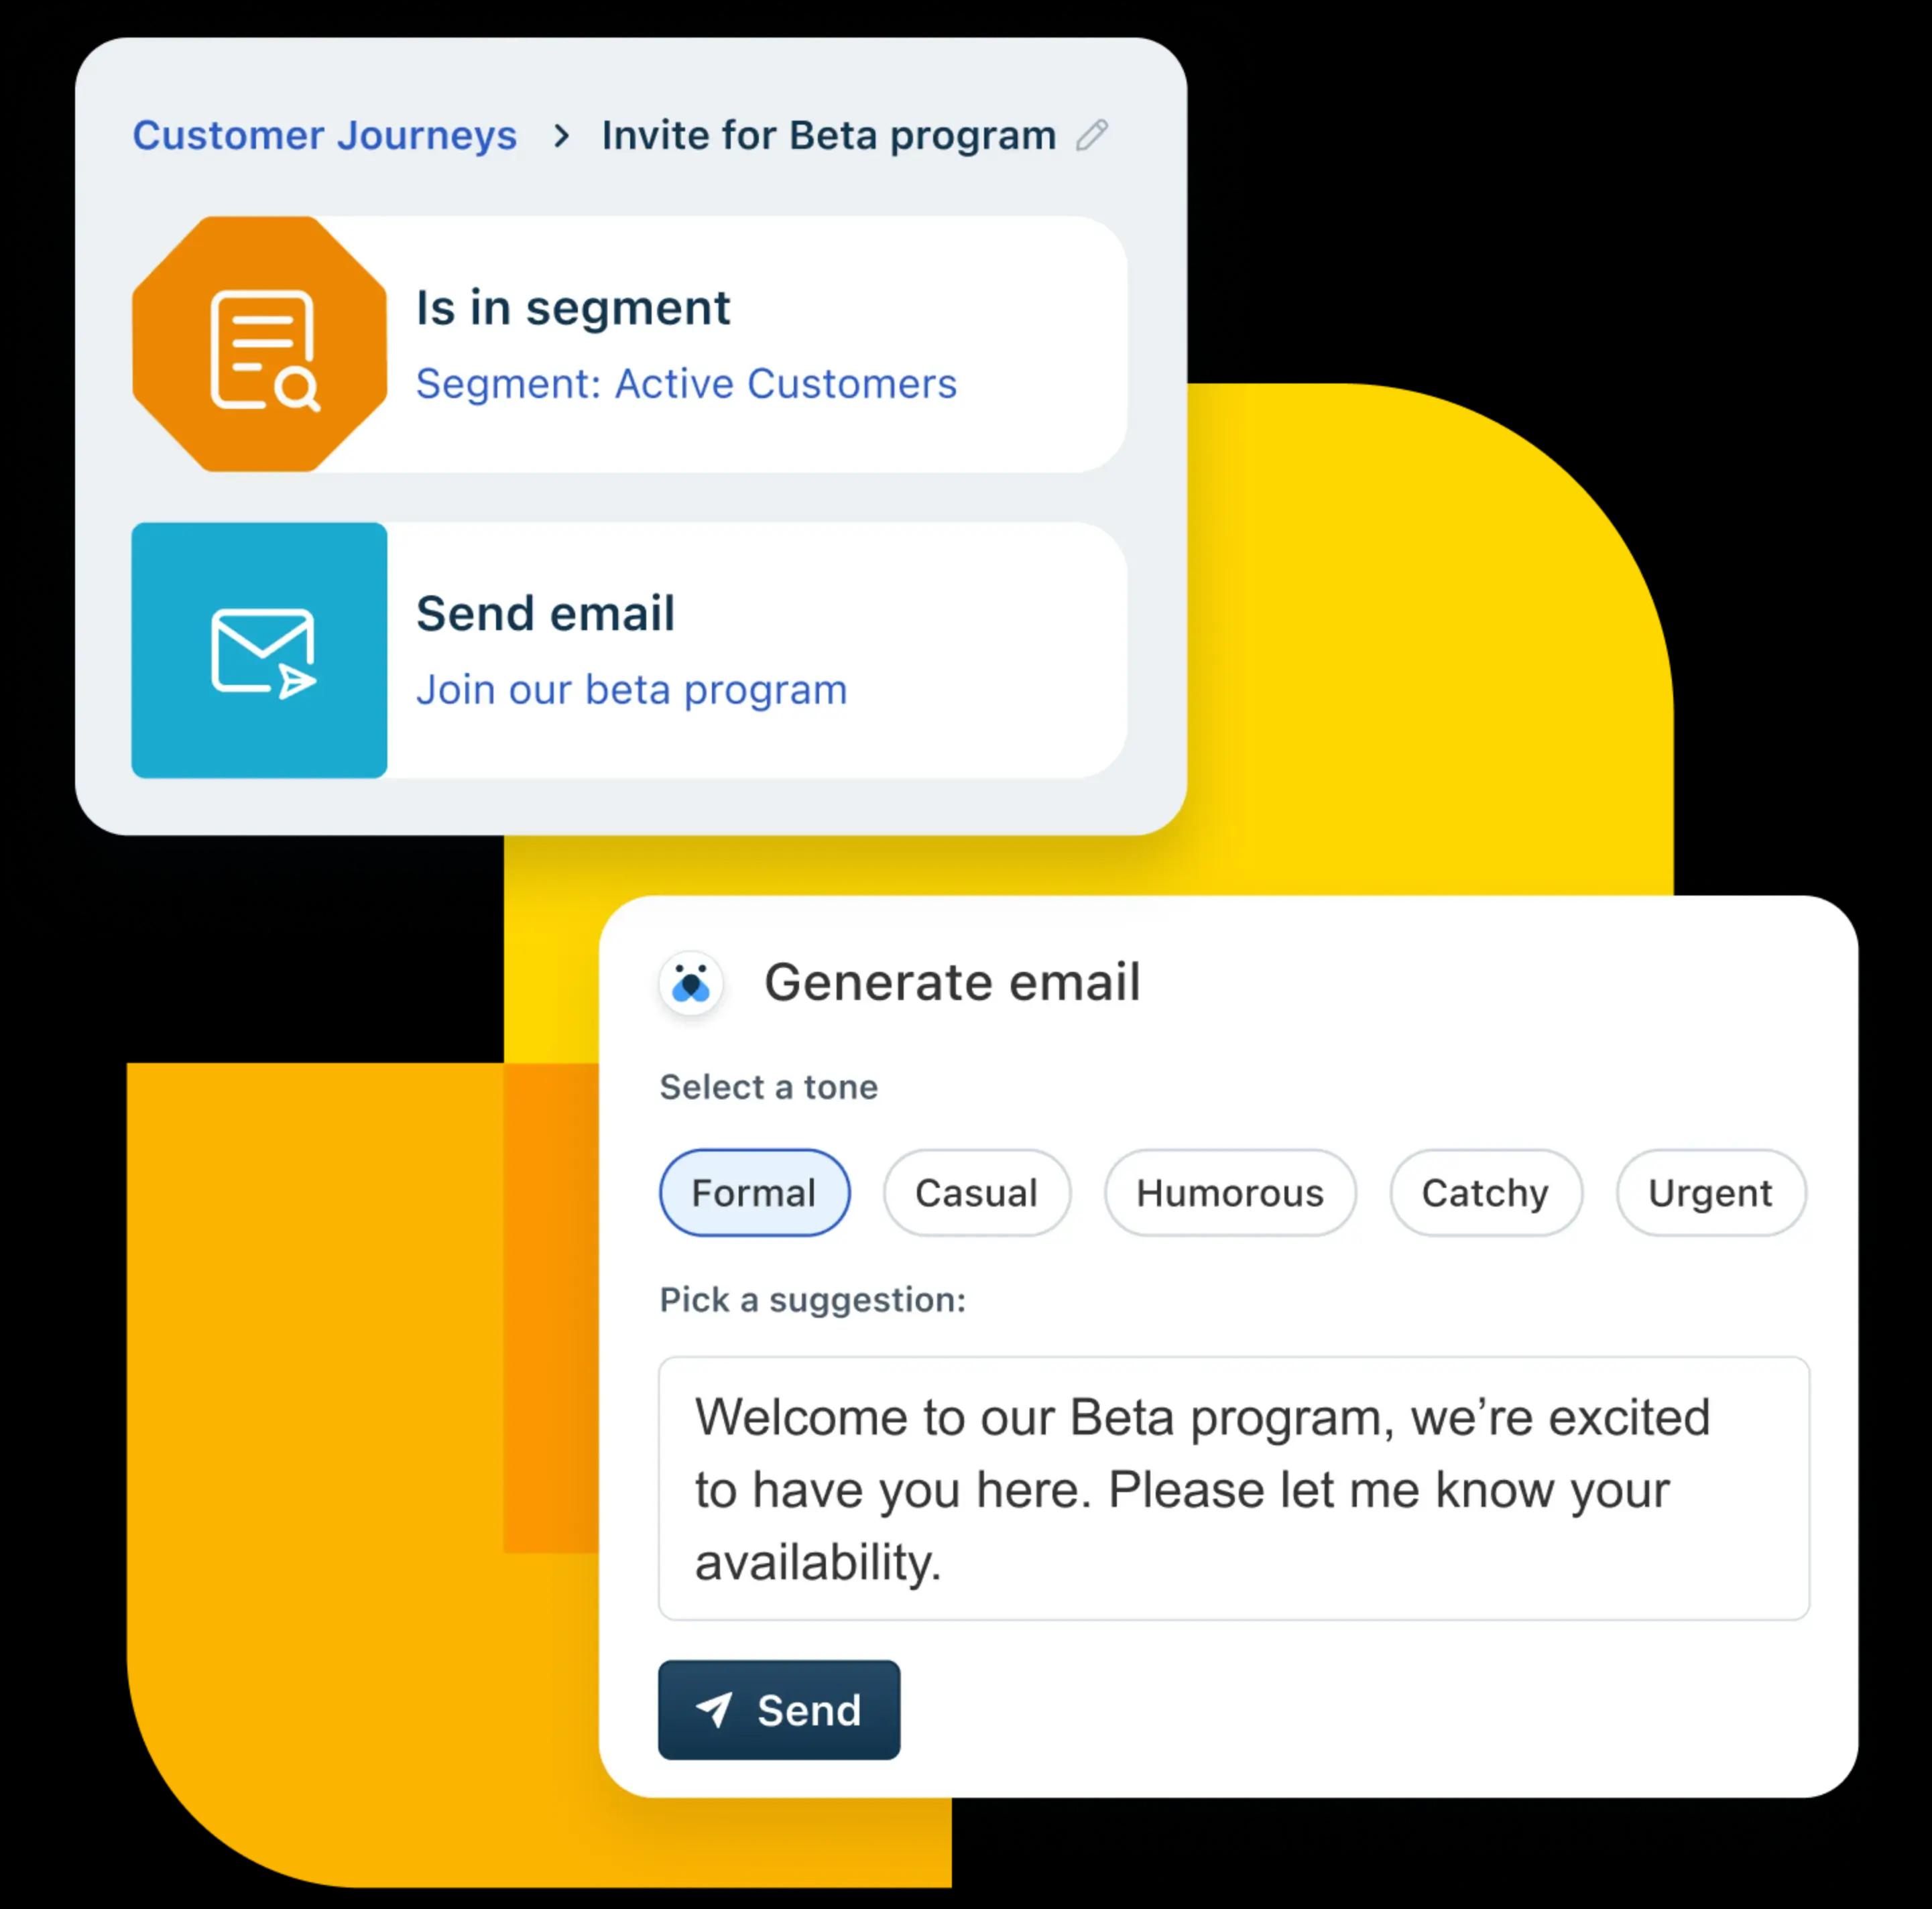
AI-powered assistance and insights
Freddy AI makes work smarter and easier, helping you around the clock: highlighting the best leads and deals, offering insights, and even writing emails. Stay a step ahead with Freddy AI.
Learn more
Get sales and marketing on the same page
Bring everything together in one complete CRM solution with a single source of truth for each customer’s journey. Share context, customize communications, and drive revenue together.
Explore Freshsales Suite
Why our customers love us


Reducing our no-show rate was important to have higher utilization of our sales team. With Freshsales, we brought it down to about 20%, and time is money.
Over the last year, we’ve acquired 10X more customers and are rapidly scaling. To our surprise and relief, through this busy phase, the time spent on administrative tasks by teams dropped by 20%.
We were able to gather intent data from email engagement and profile our audience and market to niches better. In a nutshell, the CRM became integral to our organization, rather than a supporting force.
Recommended by leading industry experts


Sign up for your free trial today
21 days. No credit card required. No strings attached.