One contact center solution for voice, AI, and every channel
From intelligent IVR and call routing to voice AI and omnichannel—handle every customer interaction in one place.
Try it free
No missed calls, lower wait times, and always available support
Freshcaller is a minimum-fuss, maximum-delight voice platform that’s right-sized for your business.


Intuitive and scalable

Conversations made easy

Effortless performance
Two-way conversations sit at the heart of any relationship
Have personalized voice interactions through high-quality and secure calls.
Set up your contact center in just a few hours
Create a global contact center for your business that’s affordable and scalable. Handle any call scenario with advanced inbound routing. Bring your own carrier (BYOC) or purchase numbers from 90+ countries.
View Freshcaller pricingDevelop a remote-ready workforce
Empower remote support and sales teams to collaborate in real-time and resolve complex issues. Virtual leaders can monitor call volumes and service level attainment while keeping track of important conversations.
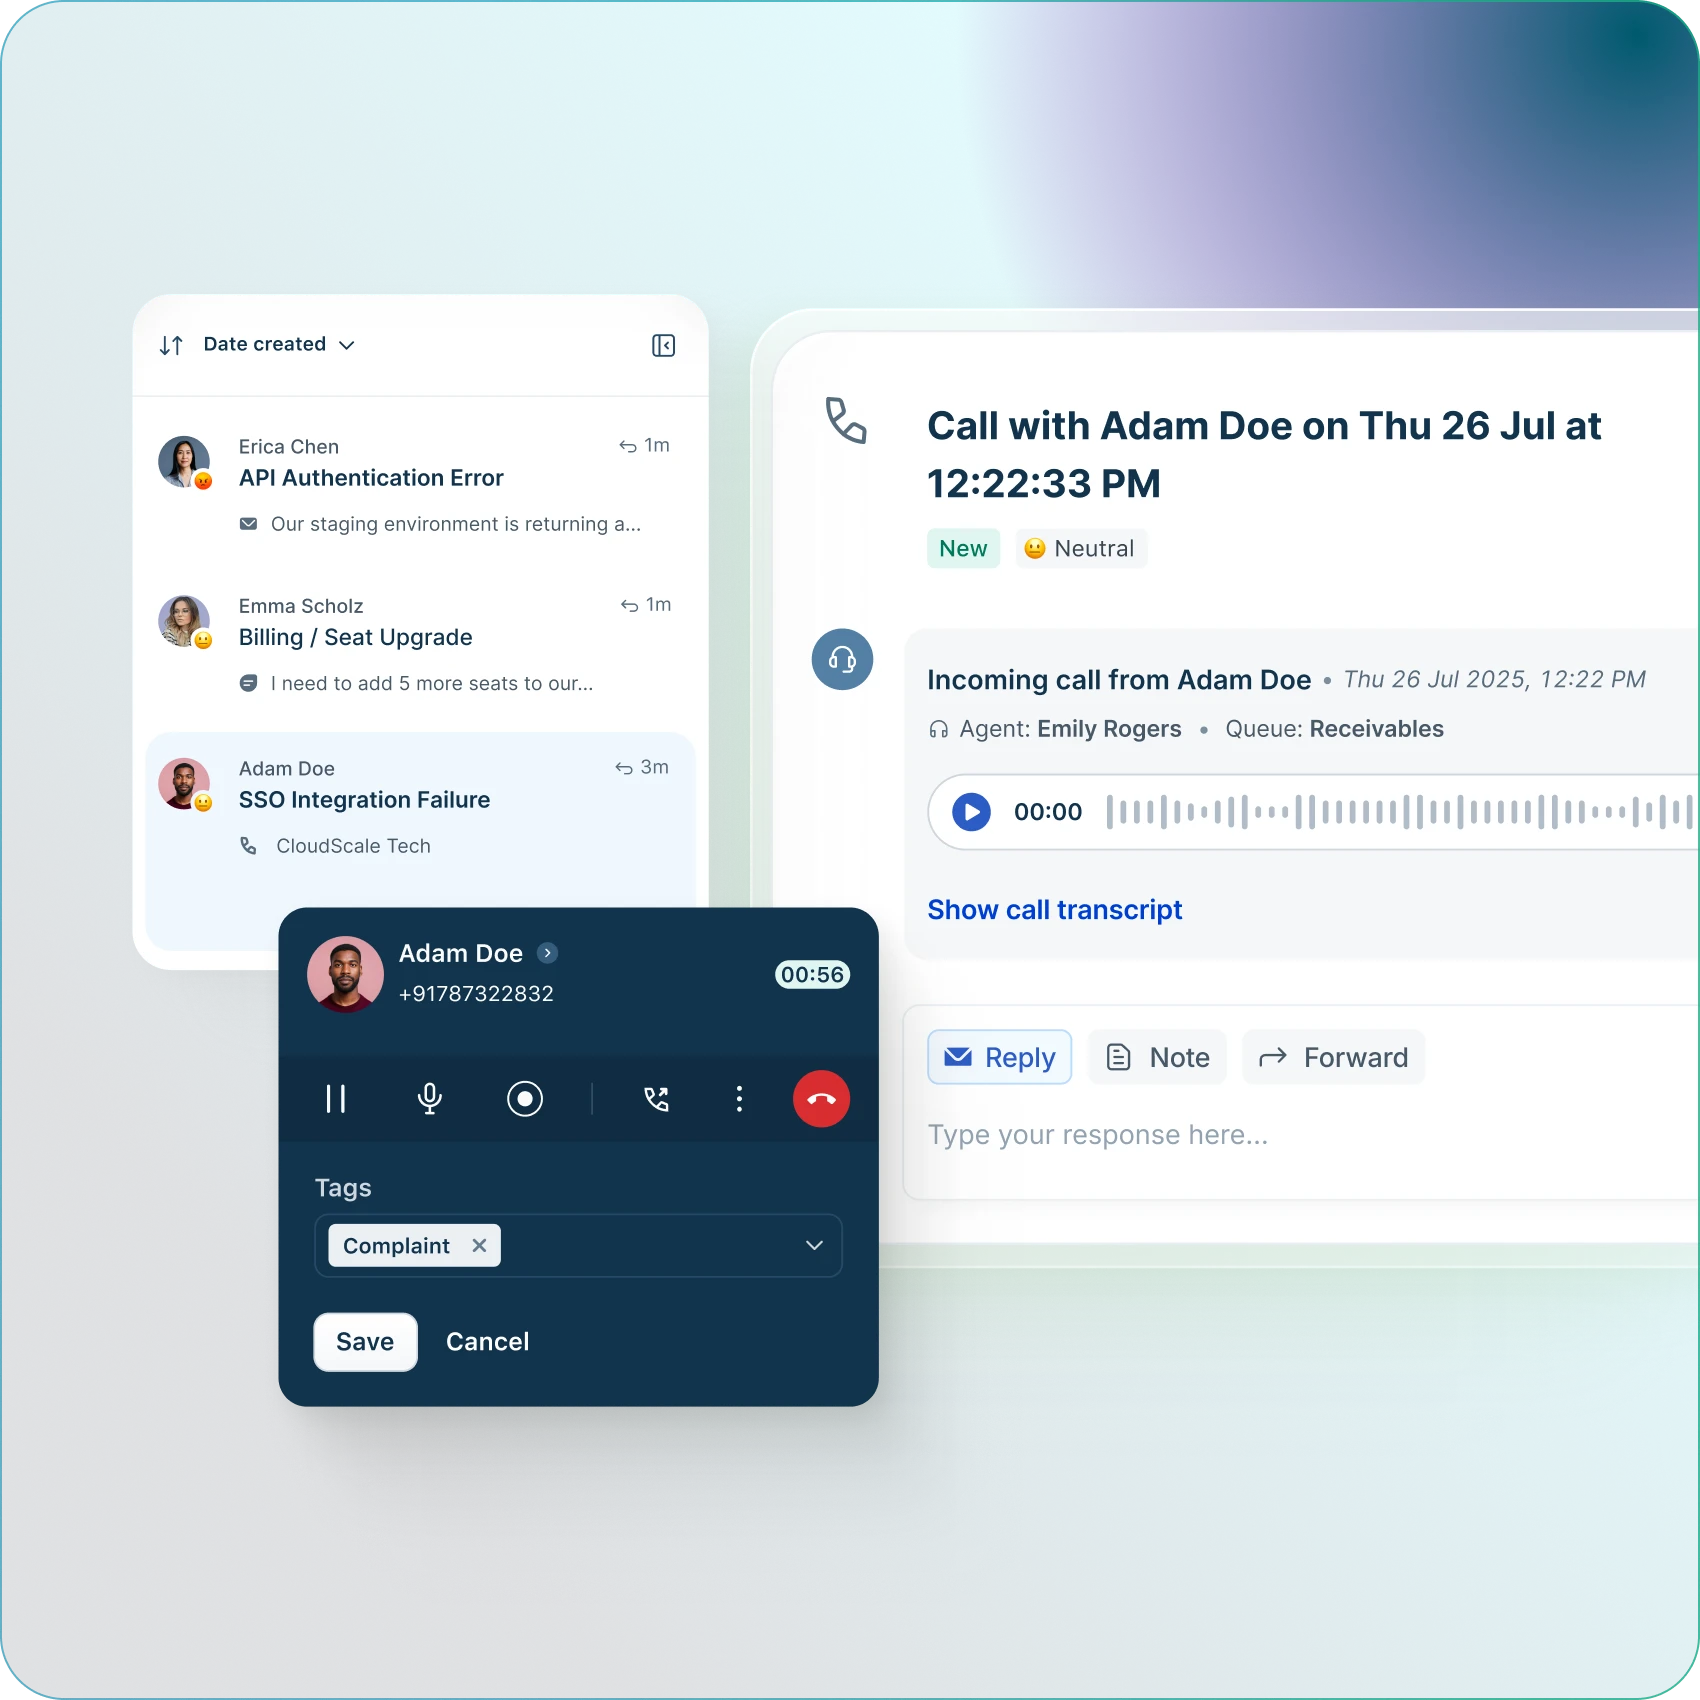
Try it freeKnow your customers better
Learn everything that happened in a call by using call recordings, post-call transcripts, and call-lifecycle information. Monitor agent performance and keep a pulse on your customer satisfaction with live dashboards.
Reduce your agent’s workload
Lighten your agents' workload by using AI-powered voice bots that answer repetitive queries. Reduce wait times and offer reliable solutions with voice bots and speech-enabled IVR. Empower your agents to do their best work.
Continue the conversation on any channel
Freshcaller is a part of the Freshdesk - a leader in effortless conversations. Make calls within Freshdesk and convert a call to a ticket with a single click. Continue the conversation across any channel, with every customer.
Read moreBetter together: Freshdesk + Freshworks Platform
Respond to challenges and scale your business on Freshdesk with the help of the unified Messaging API, easy integrations using pre-built marketplace apps, and customizable analytics. Meet the needs of an expanding customer base with the combined power of a flexible, secure, and enterprise grade platform and Freshdesk.
Explore Freshworks Platform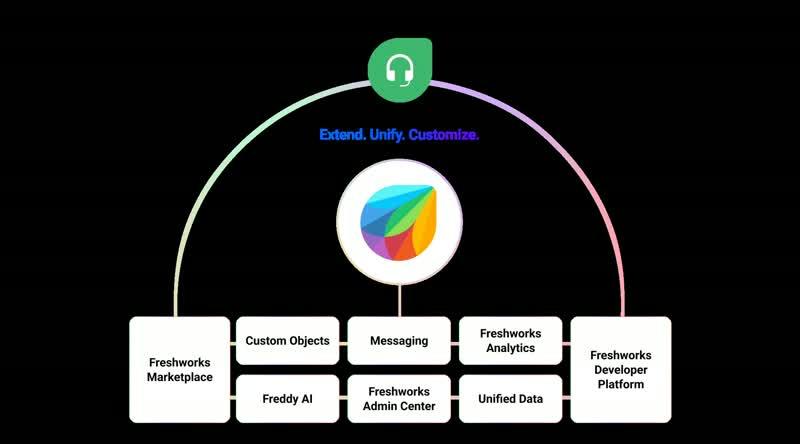
Recommended by leading industry experts


The integration across several Freshworks platforms allow all support channels to feed into one place for our Customer Care team. The ability to listen in and playback calls allows me to provide timely feedback and coaching. Additionally, access to previous communication from a customer, allows the team to deliver improved customer service.

Earlier we were using deskphones to make and receive calls, our helpdesk was not integrated with our phone systems. Our agents and reps had to run to their desks if they received a call. Freshdesk Contact Center has made things convenient for us, now we can receive and make calls from our browser — no hardware, no hassle.

Freshdesk Contact Center is a great way to record customer conversations and note down customer data and personal notes. It’s easy to take notes in Freshdesk Contact Center and all agents can view them before they make a call. Plus, we can set up multiple lines so that multiple agents can answer queries simultaneously.
Take your telephony to the cloud with Freshcaller
Sign up for a 14-day trial today!